Welcome to a temporal visualisation of wikipedia. In this page you will be able to visualize the user activity across multiple wikipedia subpart. These visualizations represent a Wikipedia sub-graph, the nodes being Wikipedia articles and the edges being Wikipedia hyperlinks between pages. The different visualisation are dynamic with the node size representing the number of viewer of the page during a given month. The activity has been taken during 3 years from November 2015 to October 2018.
To further explore our datasets, we will try to analyse activity comportements on Wikipedia.
Let's first observe the activity of Maladie de Sanfilippo in french wikipedia.
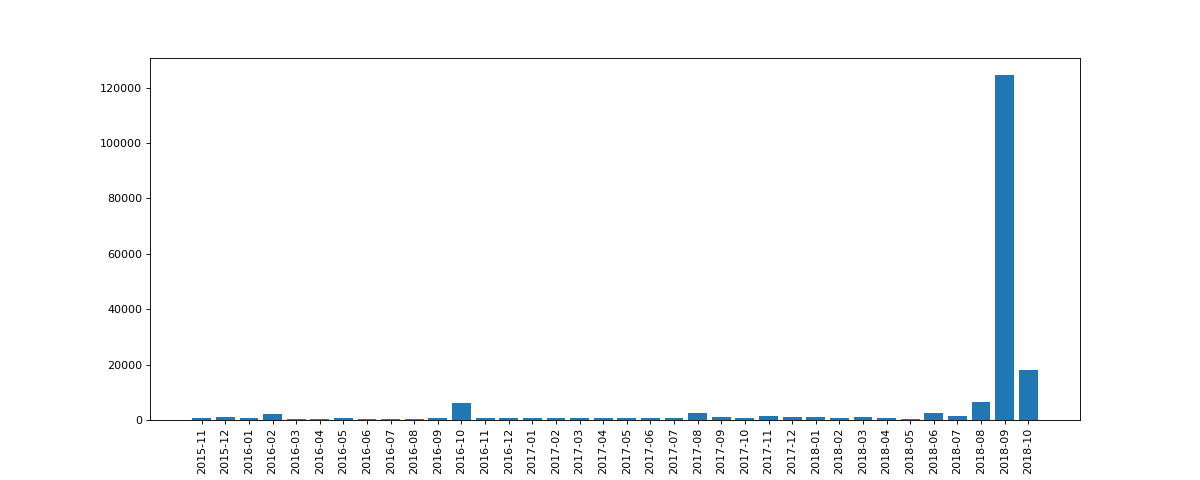
We can see on this temporal analysis that the activity of Sanfilippo wikipedia page is 24 times higher on September 2018 than in average. The explanation behind this very high sudden activity is that on September 17, a TV film Tu vivras ma fille was broadcasted by one of the main French TV broadcaster TF1, and that the main character had this disease.
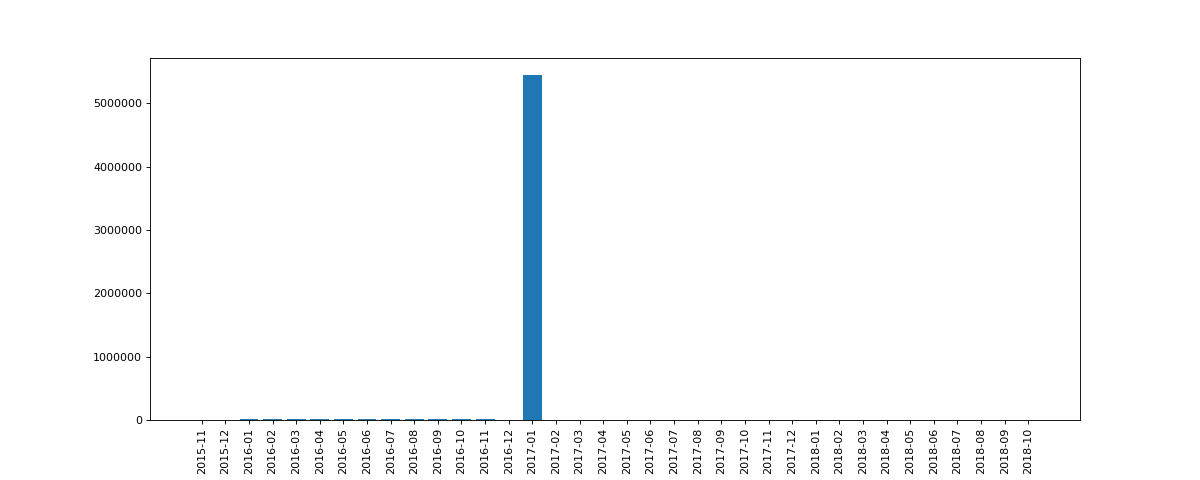
Let's now take a look at english wikipedia page 1996 in music where we also observe a peak of activity.
From this activity analysis, we can see the activity of 1996_in_music page on January 2017 is of 5.447.653 views (34 times the average activity), so the phenomenon is simillar to Sanfilippo disease but here the explication is unknown. It is the most viewed page (after wikipedia main page and wikipedia search page) in mid January, however doesn't appear on wikipedia trend page for mid february here or here. A possible reason why it doesn't appear on the trends is that the top 25 list excludes "articles that have almost no mobile views (5–6% or less) or almost all mobile views (94–95% or more) because they are very likely to be automated views based on our experience and research of the issue." And when the page had 1.131.599 desktop views on 15 January 2017, it only had 224 views from mobile-web and 44 views from mobile-app.
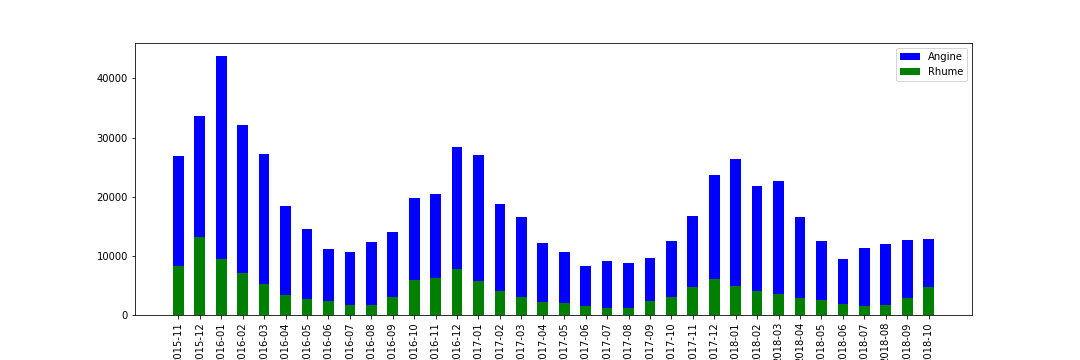
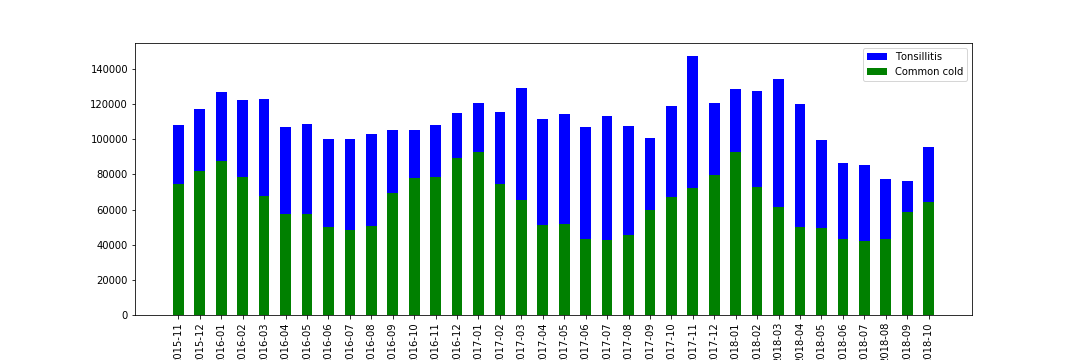
We can also observe expectable phenomenon like the augmentation of user views for the pages of diseases that often occure in winter. On French Wikipedia with Angine (Tonsillitis) and Rhume (Common cold).
However the analysis of same page on English Wikipedia is less relevant
Another event that occured on end of march 2018 is the augmenting number of view on page Chipko movement as the bar chart representing the activity on the page shows it.
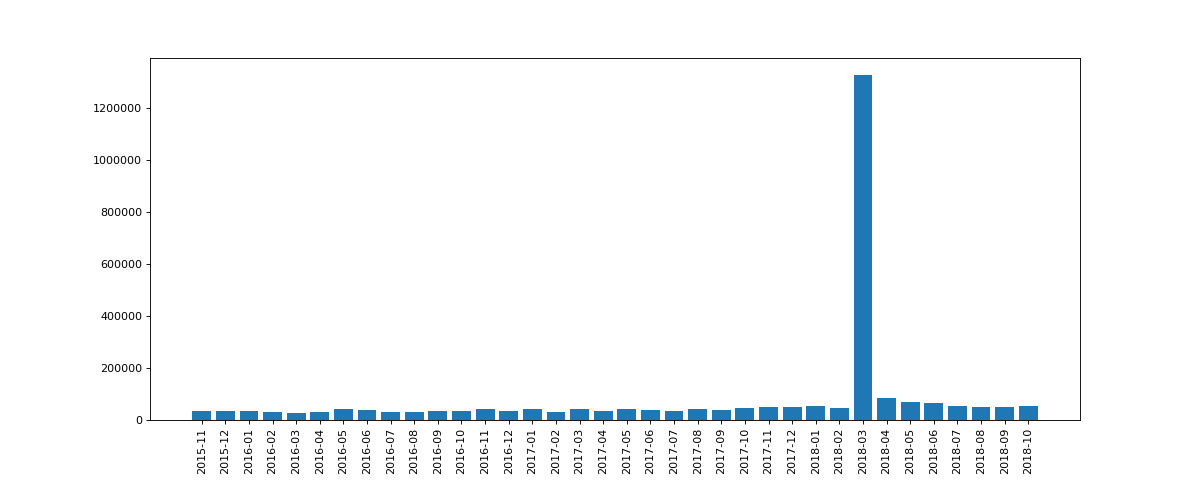
Or this is due to the Google doodle on March 26 that was related to the 45th anniversary of Chipko movement.
To further explore, and discover the cause of an unexpected activity, you can use this website https://wikimedia.org/api/rest_v1/#!/Pageviews_data/ to get the daily activity of a page and see on what day we observed a peak of activity, and we can also use https://en.wikipedia.org/wiki/Wikipedia:Top_25_Report/, if the page is in top 25 of page and it wasn't a DDos or automated views you will be able to find the causes here.